
"Is £80 a good cost per lead?" is a question we get asked constantly. The honest answer is: it depends entirely on what that lead is worth to you.
A £40 lead is a bargain for a £10,000 contract and a disaster for a £150 product.
Cost per lead only means something once you put it next to what you're actually selling. This guide covers what UK businesses genuinely pay by industry and channel. It also explains how to work out what counts as good for yours specifically.
Without a written, agreed definition, every salesperson ends up judging "opportunity" slightly differently, which quietly corrupts the metric. A simple written checklist keeps this consistent: confirmed budget range, a genuine timeline, and the right person on the call. That consistency keeps the number reliable enough to track over time and compare month to month.
Cost per lead, CPL, is simply your total spend on a campaign divided by the number of leads it generated. It's a cleaner, earlier signal than cost per sale.
It tells you how efficiently you're filling the top of your funnel. This happens before conversion rates and sales cycles start affecting the picture.
It's easy to confuse with a related metric. Cost per acquisition measures what a paying customer costs, not just a lead. Our guide on cost per acquisition covers that distinction properly.
Cost per lead sits one step earlier in the funnel, before anyone qualifies or closes the lead at all.
The UK market splits into three broad tiers. These are driven mainly by how much a converted customer is ultimately worth, and how considered the purchase is.
| Sector | Typical range | Midpoint |
|---|---|---|
| E-commerce opt-ins | £5 – £20 | £12.50 |
| Education enquiries | £12 – £35 | £23.50 |
| Healthcare / clinics | £20 – £60 | £40 |
| Real estate | £25 – £70 | £47.50 |
| Finance / insurance | £40 – £120 | £80 |
| B2B services (qualified) | £35 – £150 | £92.50 |
| Legal (qualified) | £80 – £250 | £165 |
| SaaS (qualified) | £200 – £600 | £400 |
Channel matters too. Meta Ads typically produce leads at £10 to £45. Google Ads leads usually run £25 to £90, since Google captures existing intent and converts faster. That faster conversion comes at a higher price per lead.
Cost per lead is a cleaner, earlier signal than cost per sale, but it only means something in context. An industry average from a completely different business tells you far less. What actually matters is working out what a lead is genuinely worth to you.
A qualified SaaS lead can be worth thousands of pounds in lifetime customer value. That means a business can rationally pay £200–600 for one and still turn a healthy profit. The high cost per lead reflects a high-value, considered purchase, not an inefficient campaign.
An e-commerce opt-in is usually just the first step towards a purchase worth tens of pounds, not thousands. That changes the campaign's entire economics, building it around a much lower acceptable cost per lead from the outset.

Avoid comparing your cost per lead only to an industry average from a completely different business. Instead, work it out as a percentage of your average deal value.
A £40 lead works comfortably against a £10,000 contract but becomes prohibitive at £200 order values. That's exactly why a single industry average is never the full picture.
Take your average customer value and multiply it by your lead-to-customer conversion rate. The result is the most you can rationally pay per lead before the campaign stops being profitable.
A business with a £2,000 average customer value and a 10% lead-to-customer rate has a theoretical ceiling of £200 per lead. Aiming for £100–140 in practice leaves room for the conversion rate to dip without the campaign tipping into loss.

A handful of factors explain most of the gap here. Some businesses generate genuinely efficient leads, while others are quietly overpaying for the same audience.
Work out your ceiling as a percentage of deal value, then weigh it against your actual conversion rate. A pricier lead that converts at 40% beats a cheap one converting at 5%. The offer-to-audience match is usually the single biggest lever on cost per lead itself.
A generic offer converts everyone slightly, and nobody strongly. An offer built around a specific audience's specific problem converts a narrower group far more often. That's almost always the cheaper outcome per lead, even though it looks like it should reach fewer people.
Every additional field reduces completion rate. A five-field form will almost always produce more, cheaper leads than a twelve-field one asking the same audience for the same offer. That twelve-field version may, however, hand sales slightly more pre-qualification information.
Broader targeting lowers cost per impression but often raises cost per genuinely qualified lead. That's because more of the reach lands on people who were never going to convert. The right breadth depends on how narrow the buyer persona genuinely is, not on whichever setting produces the lowest headline number.

Chasing the lowest possible cost per lead is one of the most common ways businesses quietly damage their own pipeline. A cheaper lead that never converts costs more in wasted sales time than a pricier one that closes reliably.
Our guide on improving lead quality covers this trade-off properly. The right question usually isn't "how do we lower cost per lead" but "how do we lower cost per qualified, sales-ready lead." That's a genuinely different target.
Before investing in a formal scoring model, ask sales to flag what proportion of leads from each channel or campaign were genuinely worth their time. Do this weekly. It is rough, but worth doing. A channel that consistently gets flagged as low quality despite a low cost per lead is usually not the bargain it appears to be. That's easy to miss on a spreadsheet.
Optimising a campaign purely for volume. A campaign tuned to produce the maximum number of leads, regardless of fit, usually drives cost per qualified lead up. At the same time, cost per raw lead goes down.
Sending every lead to a generic follow-up process. A lead that waits days for a response converts at a fraction of the rate of one contacted within minutes. That delay quietly inflates your effective cost per lead after the fact.
Never revisiting the offer itself. An offer that performed well a year ago can quietly stop resonating as the market shifts. When that happens, cost per lead creeping upward is often the first visible symptom.
Treating every channel's leads as equally valuable. A lead from a high-intent Google search and one from a cold social scroll are rarely worth the same amount. That's true even at an identical cost per lead.
Chasing the lowest possible cost per lead is one of the most common ways businesses quietly damage their own pipeline. The right question isn't how to lower cost per lead. It's how to lower cost per qualified, sales-ready lead, and the two mistakes above are usually why that distinction gets lost.
A campaign tuned to maximise raw lead count, regardless of fit, reliably drives cost per qualified lead up. That happens even as the headline cost per lead falls. Platforms optimise for whatever signal you give them, and "more leads" is an easy signal to satisfy with low-quality ones.
A lead that waits days for a response converts at a fraction of the rate of one contacted within minutes. That delay quietly inflates effective cost per lead after the spend has already happened.
Multiple independent studies on response times consistently find that conversion odds drop sharply once contact passes the five to ten minute mark. These studies span industries and go back over a decade, and the odds keep falling the longer it takes. The exact multiple varies by study, but the direction is remarkably consistent: faster contact converts meaningfully better, every time it has been measured.
An offer that performed well a year ago can quietly stop resonating. The market shifts, competitors adjust, or the original problem becomes less urgent. Rising cost per lead with no obvious external cause is often the first visible symptom worth investigating.
A UK professional services firm was paying roughly £110 per lead through a broad Meta campaign, well above what felt sustainable against their £1,800 average contract value. Rather than cutting spend, they narrowed targeting and shortened the lead form from nine fields to four.
They also rebuilt the landing page around one specific, clearly stated offer.
Cost per lead dropped to £58 within a month. The leads that did come through converted to paying clients at a noticeably higher rate than the previous broader campaign.
Overall, the total number of leads fell slightly, but cost per customer improved considerably.
The lesson wasn't that cheaper leads are always better. It was that the right cost per lead is the one that produces the best cost per customer, not the lowest number on a dashboard.
The same offer, run on different platforms, rarely produces the same cost per lead, because each platform captures a different kind of attention at a different point in the buying journey.
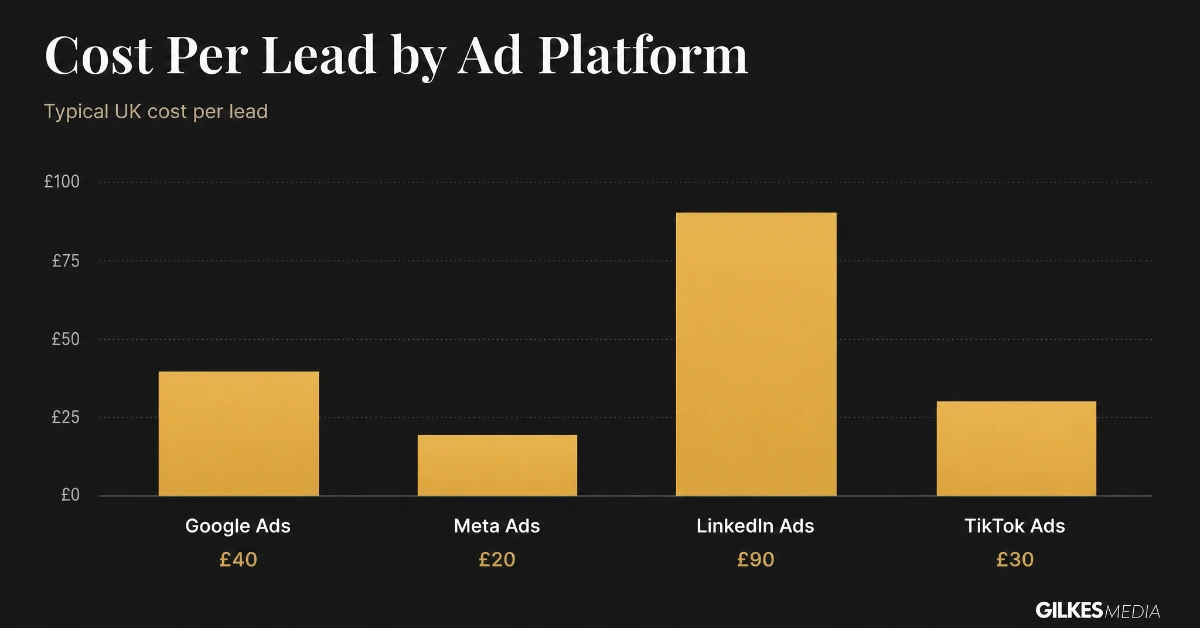
Google captures people already searching for a solution, so leads typically run £25–90 depending on how competitive the keyword is. It is usually the most expensive per lead of the major platforms. However, the leads tend to be further along and easier to convert. Our guide on Google Ads cost in the UK is worth reading alongside this one.
Meta typically produces leads at £10–45, considerably cheaper than Google, because it interrupts rather than captures existing intent. That lower cost usually comes with a wider spread of lead quality, so a proper qualification step matters more here than on Google.
LinkedIn's job-title and seniority targeting is unmatched for reaching a specific professional audience. That precision comes at a cost, though: qualified B2B leads commonly run £50–200 or more. Our guide on LinkedIn Ads cost in the UK breaks this down in more detail. The premium is usually worth paying when the buyer persona is genuinely narrow.
TikTok's cost per click sits well below every other platform here. Where it does produce a direct lead, that lead often lands around £20–£40. The bigger caveat is volume: for most B2B categories it produces very few direct, qualified leads at all. Our guide on TikTok ads for B2B covers where it does and does not earn a place in a serious lead generation mix.
Cheapest cost per lead and best cost per qualified lead are two different questions, and platform choice changes the answer to both.
Chasing a lower number on its own is how businesses end up with more leads that convert worse. The tactics below are the ones that tend to lower genuine cost per qualified lead, not just cost per raw form fill.
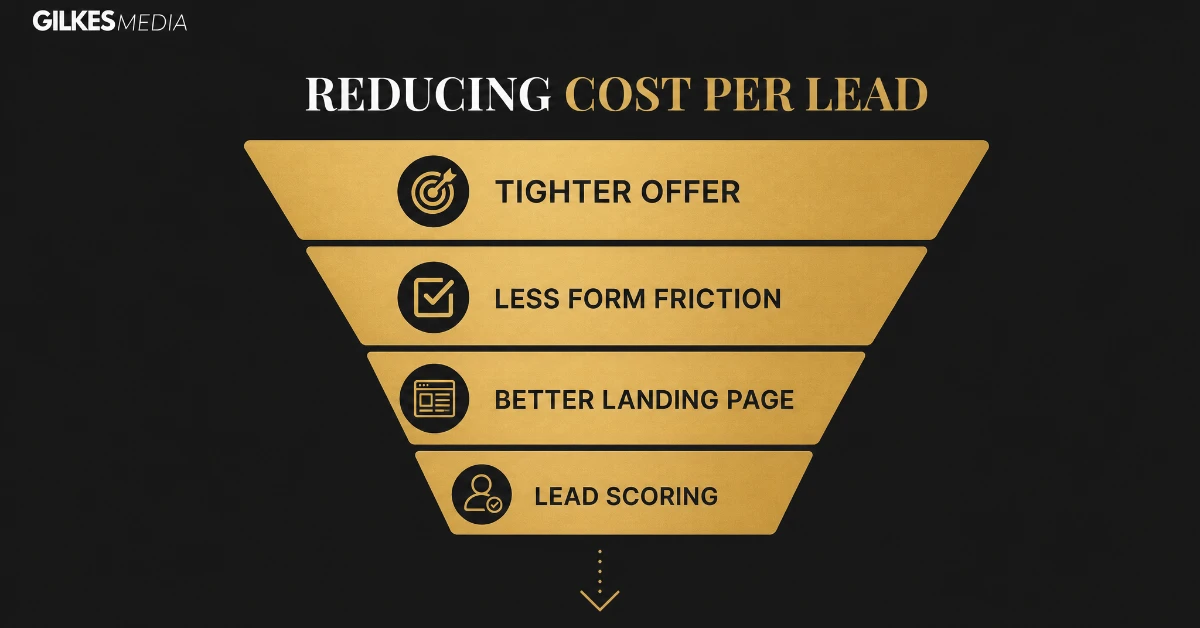
An offer built around one specific problem a buyer already knows they have converts considerably better than a generic "get in touch" or "book a call" form. That's also what makes it cheaper per lead. Naming the problem in the headline does more to lower cost per lead than almost any targeting change.
Remove fields that don't change how you handle the lead, and keep only the ones that genuinely affect qualification or routing. Doing this is usually the single fastest way to lower cost per lead. A phone number and a one-line "what are you looking to solve" field often does more qualifying work than five extra fields. Most forms still ask for those extra fields out of habit.
A landing page converts noticeably better when it states the offer clearly, removes navigation that lets visitors wander off, and gives one obvious next action. That's a clear improvement on a generic page repurposed from the main site. Cost per lead is spend divided by leads. That means doubling a landing page's conversion rate has the same effect on cost per lead as halving the media spend.
A proper lead scoring model lets a business keep optimising campaigns for volume where that makes sense. It's covered in full in our guide to lead scoring for UK businesses. At the same time, it routes sales effort only to the leads actually worth the follow-up. This solves the volume-versus-quality tension directly instead of forcing a choice between them.
Cost per lead is only one point on a longer funnel. Treating it as the only number that matters is how businesses end up optimising the wrong thing.
Cost per opportunity sits between cost per lead and cost per acquisition. It measures what it costs to produce a lead that a salesperson judges genuinely worth pursuing. It strips out the leads that were never realistic in the first place. That gives a cleaner read on marketing's real contribution than raw cost per lead ever can.
Cost per acquisition measures what a paying customer costs, all the way through the funnel. It's covered in full in our guide to calculating customer acquisition cost. A campaign with an excellent cost per lead but a poor cost per acquisition usually has a qualification or sales-process problem, not a marketing one.
A business watching cost per lead alone can look like it is improving quarter over quarter, even while cost per acquisition quietly gets worse. That happens because the extra leads are lower quality and convert at a lower rate further down the funnel. Tracking all three numbers together, even roughly, catches this before it shows up in revenue.
It depends entirely on the sector and what a converted lead is worth. As a rough guide, e-commerce opt-ins often sit around £5–20, B2B services £35–150, and qualified SaaS leads £200–600. A "good" cost per lead is one comfortably below what a lead is worth to your business, not a fixed number.
Usually one of: a broad or generic offer, a form asking for too much too soon, a landing page that buries the offer, or targeting spread too wide. Industry averages also vary hugely by how considered the purchase is, so compare against your own sector’s range, not a generic figure.
Meta and TikTok typically produce the cheapest raw leads, but Google and LinkedIn usually produce a higher proportion of genuinely qualified ones. The cheapest cost per lead and the cheapest cost per qualified lead are frequently different platforms entirely.
No. Optimising purely for volume tends to raise cost per qualified lead even while cost per raw lead falls. Track cost per qualified lead, or ideally cost per opportunity, alongside the raw number.
Within minutes where possible. Response times measured in hours or days meaningfully lower conversion rates on leads you have already paid for, which quietly inflates your effective cost per lead after the fact.
Not on its own. A cheaper lead that converts at half the rate of a more expensive one usually costs more per sale overall. Cost per lead is a useful early signal, but it should always be read alongside conversion rate and lead quality.
There's no single correct cost per lead for every business, but there is a sensible way to arrive at yours. Work it out as a percentage of deal value, then weigh it against your actual conversion rate. Judge it on cost per customer rather than cost per lead in isolation.
Our guide on calculating customer acquisition cost is worth reading alongside this one. It gives the fuller picture beyond a single metric.
You may not be sure whether your current cost per lead is genuinely good or quietly wasting budget. That's exactly the kind of thing worth an honest, outside look.
Our paid ads management service covers Google, Meta, LinkedIn and TikTok, and we'll tell you plainly whether your numbers stack up.
Get in touch through our contact page for a free discovery call. We'll give you a straight read on what a good cost per lead looks like for your specific business.
The worked example makes the point plainly. Shortening the form and sharpening the offer cut cost per lead nearly in half, while conversion to paying client actually improved. There's no universally correct cost per lead, only a sensible way to arrive at yours. That includes the discipline to judge it on cost per customer.
Most UK businesses get more value from tracking three numbers side by side than obsessing over any single one. Cost per lead works as an early efficiency signal. Cost per opportunity works as a quality check. Cost per acquisition is the number that ultimately decides whether a campaign is profitable. A campaign can look excellent on the first number and still be quietly losing money by the third.
Review all three monthly rather than daily. Cost per lead reacts quickly to changes in targeting or creative. Cost per opportunity and cost per acquisition need a larger sample size before the numbers mean anything. Reacting to daily noise in those figures usually does more harm than good.
There's one habit worth adopting from everything above. Before a campaign launches, write down what a good cost per lead actually looks like for that specific offer and audience. Use the break-even formula for this, rather than an industry average pulled from somewhere else. That single step turns cost per lead from a vague feeling into a solid number. It comes with a clear pass or fail threshold attached to it.
The businesses that make the best decisions about cost per lead are the ones who agree on a number upfront. Before a campaign launches, they decide what would count as a pass and what would count as a fail. Deciding this after seeing the results almost always leads to moving the goalposts to match whatever number came back. That defeats the entire point of tracking it.
That agreement does not need to be complicated. A single sentence like "we consider this campaign working if cost per qualified lead stays under £X for two consecutive months" is usually enough. Written down and agreed before spend starts, it removes most of the arguments that otherwise happen after the fact.
An industry range is a useful starting sanity check the first time you run a campaign. But your own historical cost per lead tells you far more than a generic benchmark ever will. That's especially true once you track how it moves as you change offers, forms, and targeting. Two businesses in the same sector can have a genuinely different "good" number because their average customer value, sales process, and conversion rates are different.
Keep a simple running record, month, channel, spend, leads, cost per lead, and note alongside it what changed that month. Within two or three quarters, this becomes a far more reliable guide to what "good" means for your specific business than any published UK average. That includes the ranges in this article.
Don't copy the figures in this guide into a plan unchanged. They are a starting point for a sensible conversation about what your business can afford to pay. They are not a target to hit for its own sake. The businesses that get the most value from tracking cost per lead treat it as one input into a bigger decision. That decision includes spend allocation, channel mix, and sales capacity, not cost per lead by itself.
Revisit the number quarterly at minimum. Do this whenever something upstream changes meaningfully: a new offer, a pricing change, a shift in the sales process, or a new competitor entering the market. Cost per lead that looked healthy six months ago can quietly stop being healthy without anyone noticing, simply because the context around it moved.
If there is one thing to take away from this guide, let it be this. Cost per lead only becomes a genuinely useful number once you tie it to what a lead is actually worth to your business. It also needs tracking consistently over time, and reading alongside cost per opportunity and cost per acquisition, rather than in isolation. Get that structure right, and the raw number stops being a source of anxiety and starts being a genuinely useful early warning system.
That is a more useful outcome than chasing the lowest possible number on the dashboard. It's also the difference between cost per lead as a genuinely strategic metric, and cost per lead as a vanity figure. That vanity figure just happens to look good in a monthly report.
Get that part right, and everything else in this guide becomes far easier to apply correctly to your own business. That includes the sector benchmarks, the platform comparison, and the mistakes to avoid.