
At its core, measuring your marketing return on investment (ROI) is simple. You take the revenue from your marketing, subtract the cost, and divide it by the cost. The formula looks like this:
(Revenue from Marketing - Marketing Cost) / Marketing Cost
The number you get back tells you how much you made for every pound you spent. Swap revenue for gross profit and it gets more honest still (more on that below). Done properly, it is the first step in turning marketing from a perceived expense into a proven driver of growth.
For any business leader in the UK, understanding marketing ROI is not just a reporting task, it is fundamental to sustainable growth. Anyone can find the formula online, but the real challenge is proving marketing's direct impact on the bottom line, especially when your customers find you through multiple channels over weeks or even months.
Without that clarity, marketing budgets are built on guesswork. This guide moves past vanity metrics like clicks and impressions and focuses on the numbers that hit your profit and loss: which activities are fuelling growth, and which are draining your budget.
So many businesses operate with a vague sense of what is working. A Google Ads campaign seems to bring in leads, and social media feels active, but the direct link to sales is often a blurry line. This ambiguity creates serious commercial risks that can hold you back.
It all comes down to priorities. Too many businesses make the costly mistake of putting marketing activity ahead of analytics, which undermines any chance of building a data-driven strategy.
As a senior marketing consultant and paid ads specialist, I have seen this shift happen time and again. The moment a business commits to proper ROI measurement, the conversation changes from "How much are we spending?" to "How much revenue are we generating?".
This is the very essence of performance marketing, a discipline focused entirely on measurable, commercially-driven results. If you are new to the concept, our guide on what performance marketing is explains how it drives accountability and growth.
Effective ROI measurement gives you the confidence to treat marketing not as an expense, but as a direct investment in customer acquisition. It provides the financial proof needed to scale campaigns, test new channels, and build a predictable engine for business growth.
Ultimately, mastering marketing ROI is about control. It lets you answer the questions that matter with data you can trust: where should the next pound go, which campaigns should we kill, and which should we scale?
Before you can calculate a single thing, you need the foundations right. Any attempt to measure marketing ROI is doomed if your data is messy or your objectives are fuzzy. That means clear, commercially focused goals and tracking set up to measure what actually matters to the business. Without this groundwork, you are just measuring noise.
First things first: translate your big-picture business goals into specific marketing objectives. If the business needs to increase revenue by 20%, your marketing objective is not "get more traffic". It is to generate a precise number of qualified leads or a certain value of sales through your campaigns.
Here is what that looks like in practice:
See how that simple translation connects your day-to-day marketing activities directly to the P&L?
One of the most common mistakes is setting marketing goals in isolation. Objectives like 'increase brand awareness' are practically meaningless without a commercial outcome attached. A much stronger approach is to frame it as 'increase brand awareness among our target audience to shorten the sales cycle by 15%'.
Getting measurement right is a genuine challenge. Industry research shows that while 83% of marketing leaders say demonstrating ROI is a top priority, only 29% feel they can actually measure it effectively. That gap between intent and capability usually comes down to a weak foundational setup. You can explore more content marketing statistics for the wider picture.
Once your objectives are locked in, define the Key Performance Indicators (KPIs) that track progress towards them. Your KPIs will differ depending on your business model and the type of campaign, but they should always reflect real commercial momentum, not busywork.
| Campaign Type | Primary Business Goal | Key Performance Indicators (KPIs) |
|---|---|---|
| Lead Generation | Acquire new business leads | Cost per SQL, SQL to Customer Rate, Funnel Velocity |
| E-commerce | Drive online sales | Return on Ad Spend (ROAS), Average Order Value (AOV), Customer Lifetime Value (LTV) |
| Brand Awareness | Increase market presence | Branded Search Volume, Direct Traffic, Share of Voice |
Notice how these KPIs are all tied to financial outcomes. A lower Cost per SQL directly improves profitability, while a higher ROAS shows you are using ad spend efficiently. A simple rule: your primary KPI should be the metric closest to revenue. Everything else is there to help you diagnose problems.
Your objectives and KPIs are useless without the tools to track them. A modern analytics setup is not a nice-to-have; it is the bedrock of any credible attempt to measure marketing ROI. At a bare minimum, your technical foundation must include:
Getting this setup right ensures that when a lead or sale comes in, you have a clear data trail to understand exactly which marketing touchpoint delivered it. Without this, attribution becomes a wild guessing game, and your ROI calculation will be built on sand.
Tracking breaks quietly. A site update removes a tag, a form plugin changes, and conversions stop recording while the spend carries on. Build in regular checks:
Right, you have got your objectives and KPIs sorted. Now for the numbers that really matter: the maths behind your marketing performance.
You can track dozens of metrics, but most UK businesses only need a handful of core formulas to make smart commercial decisions: Return on Investment (ROI), Customer Acquisition Cost (CAC) and Customer Lifetime Value (LTV), plus Return on Ad Spend (ROAS) if you run paid media. Together they translate marketing spend into a language finance and the board can act on.
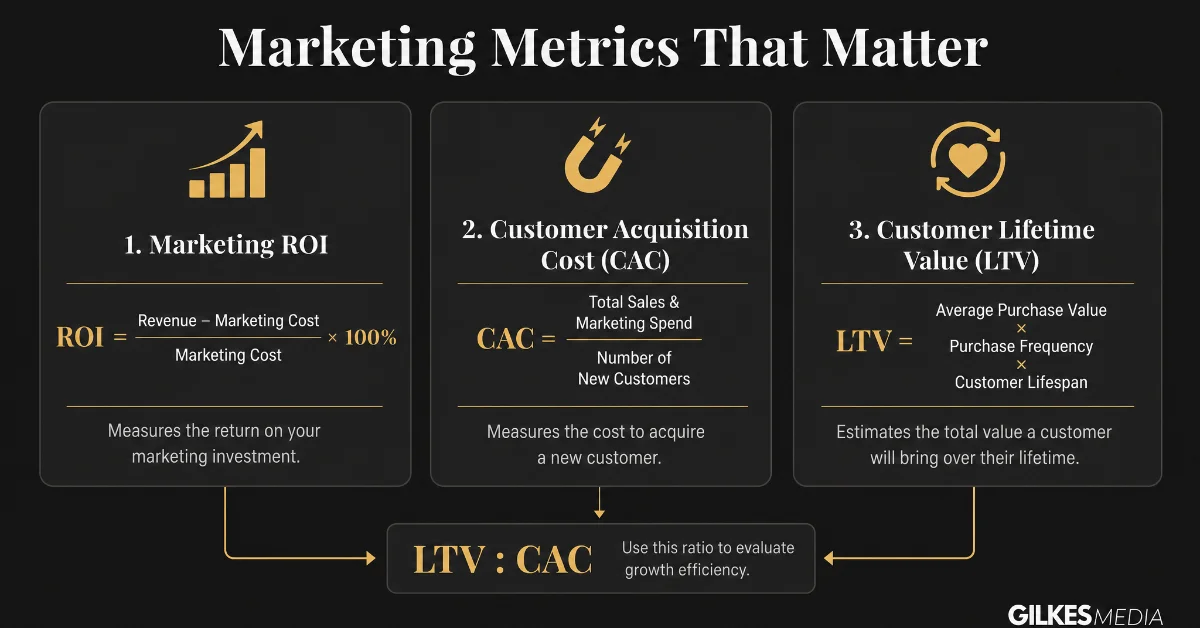
This is the big one. ROI tells you the net return you got from a specific marketing investment, making it the ultimate measure of profitability.
A positive ROI means the campaign made more than it cost; a negative one means it lost money. Simple as that.
The formula looks like this:
(Gross Profit from Marketing - Marketing Cost) / Marketing Cost x 100 = ROI %
It is crucial to use gross profit here, not revenue. Revenue flatters the result until you account for the cost of delivering your product or service (often called Cost of Goods Sold or COGS).
Imagine a professional services firm spends £5,000 on a Google Ads campaign in a single quarter.
Now, let's plug that into the formula:
(£18,000 - £5,000) / £5,000 x 100 = 260% ROI
For every £1 spent on this campaign, the business generated £2.60 in profit after covering the ad spend. That is the kind of number that lets you justify a budget with confidence. For a broader look at this, see this guide on how to measure marketing ROI, which covers further formulas and strategies.
ROAS is the paid media cousin of ROI. It ignores margins and overheads and simply tells you how much revenue each pound of ad spend brought in. Ad platforms report it by default, which is why it gets quoted so often.
Revenue from Ads / Ad Spend = ROAS
In the Google Ads example above, £30,000 of revenue from £5,000 of spend is a 6:1 ROAS. That is healthy, but only because the margin is 60%. The same ROAS on a thin-margin product could barely cover costs.
The trap is chasing a generic benchmark. A 3:1 ROAS is often quoted as a baseline, but whether 3:1 makes you money depends entirely on your margin. Work it out from your own numbers:
1 / Gross Margin = Break-Even ROAS
Set your target above break-even, with enough headroom for overheads and the profit you actually want. That is your real target, not someone else's benchmark.
While ROI focuses on profitability, Customer Acquisition Cost (CAC) measures efficiency. It tells you exactly how much you have to spend, on average, to win a single new customer through a particular channel or campaign.
A lower CAC is almost always better, as it means you are winning customers more efficiently.
The formula is nice and straightforward:
Total Marketing & Sales Spend / Number of New Customers Acquired = CAC
Remember to include all the relevant costs, not just the ad spend. This should cover salaries, software subscriptions, and any agency fees tied to that acquisition effort.
Let's say an e-commerce business spends £2,000 on a Meta Ads campaign over one month.
The CAC calculation is:
£2,000 / 40 = £50 CAC
This tells us it costs the business £50 to acquire each new customer through Meta Ads. That figure becomes far more useful when you compare it against your average order value or, better still, the customer's lifetime value. To go deeper, read our guide to cost per acquisition (CPA) and its role in your wider strategy.
Customer Lifetime Value (LTV) is the final piece of the puzzle. It predicts the total net profit your business can expect to make from a single customer over the entire time they do business with you.
LTV gives you the long-term context you need to properly evaluate your CAC. Is that £50 CAC good or bad? LTV holds the answer.
A simple LTV calculation is below. Multiply the result by your gross margin if you want LTV in profit terms, which is the fairer comparison against CAC.
(Average Purchase Value x Average Purchase Frequency) x Average Customer Lifespan = LTV
A SaaS business wants to figure out the value of customers it acquires through content marketing.
The LTV calculation is:
(£100 x 12 months) x 3 years = £3,600 LTV
The real strategic magic happens when you compare LTV to CAC. A healthy business model typically has an LTV to CAC ratio of 3:1 or higher. In our examples, the e-commerce business has a CAC of £50. As long as their LTV is over £150, their acquisition strategy is sustainable and profitable.
This table breaks down the key formulas, what they measure, and why they should be on your dashboard. It is your cheat sheet for making smarter, data-backed decisions.
| Metric | Formula | Business Purpose |
|---|---|---|
| Return on Investment (ROI) | (Gross Profit - Marketing Cost) / Marketing Cost | Measures the direct profitability of a marketing campaign. Answers: "Did we make more money than we spent?" |
| Return on Ad Spend (ROAS) | Revenue from Ads / Ad Spend | Measures how hard each pound of ad spend works. Answers: "Is this campaign above our break-even ROAS?" |
| Customer Acquisition Cost (CAC) | Total Marketing & Sales Spend / New Customers | Measures the cost efficiency of acquiring a new customer. Answers: "How much does it cost us to win one customer?" |
| Customer Lifetime Value (LTV) | (Avg. Purchase Value x Avg. Purchase Freq.) x Avg. Lifespan | Predicts the total profit from a single customer over time. Answers: "What is a customer worth to us long-term?" |
Get these four numbers onto one page and you stop guessing what works. You know how your marketing spend is turning into profit, and where it is not.
The formulas we have covered are powerful, but they all depend on one critical thing: clean, accurate data. Without a reliable way to track where your leads and sales actually come from, any ROI calculation is pure fiction. This is where a solid tracking and attribution framework becomes non-negotiable.
The simplest, yet most effective, tool in your tracking arsenal is the Urchin Tracking Module, or UTM parameter. These are just short snippets of text added to the end of a URL that tell your analytics platform precisely where a visitor came from.
Getting your UTM structure right is fundamental. It is the difference between seeing a vague "Direct" traffic source in your reports and knowing that a specific email in your autumn campaign drove £5,000 in sales.
A well-structured UTM link typically includes these components:
google, meta, linkedin).cpc, email, social).q4_sale, ebook_launch).Keep everything lowercase and agree one naming convention across everyone who builds links. GA4 treats "Facebook", "facebook" and "fb" as three different sources. Used consistently, UTMs give you a clean, organised dataset in Google Analytics, and channel performance becomes clear.
Once you are tracking where traffic originates, the next question is how you assign credit for a sale. This is the job of an attribution model. A customer might see a Meta ad, click a Google search result a week later, and finally convert from an email. So, which touchpoint gets the credit?
Your choice of model has a huge impact on your perceived ROI and, consequently, your entire strategy. There is no single "best" model; the right one depends entirely on your business and the typical length of your sales cycle.
A common mistake is to stick with the default 'Last-Click' model simply because it is the easiest. This model gives 100% of the credit to the final touchpoint before a conversion, ignoring every interaction that came before it. It is a dangerously incomplete view of how people actually buy.
Let's compare the most common models to help you decide which fits best.
| Attribution Model | How It Works | Best For Businesses With... |
|---|---|---|
| Last-Click | Assigns 100% credit to the final touchpoint before conversion. | Short sales cycles and impulse buys, such as fast-moving e-commerce products. |
| First-Click | Assigns 100% credit to the very first touchpoint a customer had. | A primary goal of generating new top-of-funnel awareness and leads. |
| Linear | Distributes credit evenly across all touchpoints on the path to conversion. | Long consideration periods where multiple interactions are valued equally. |
| Time-Decay | Gives more credit to touchpoints closer to the conversion. | Shorter considered purchases where the final interactions carry most weight. |
| Data-Driven | Uses machine learning to assign credit based on your actual customer data. | Sufficient conversion data for the algorithm to find meaningful patterns. |
To make this practical, let's look at two different UK businesses.
One practical point. In 2023 Google retired the first-click, linear, time-decay and position-based models from GA4 and Google Ads, so inside those platforms you now choose between data-driven and last click. The other models are still useful ways of thinking, and you can apply them in a spreadsheet or a dedicated attribution tool, but you will not find them in GA4.
Before you change the model you rely on, compare. GA4's model comparison report shows how credit shifts between channels under different models. Run it across a full sales cycle and look at which channels gain or lose credit before you move any budget.
Theory and formulas are great, but the real magic happens when you see all your data in one place. Your ability to consistently measure marketing ROI hinges on wrangling those messy data streams into a single, coherent dashboard. This is not about splashing out on expensive software; it is about connecting the powerful, free tools you probably already use.
The goal is a single source of truth: one view that turns raw campaign data into business intelligence clear enough for your leadership team to grasp in seconds, but deep enough for you to make smart optimisation calls.
You do not need a sprawling tech stack to get started. For most UK businesses, a handful of core platforms gives you everything required to track performance from the first click to the final conversion.
Your foundational toolkit should include:
The key is not just having these tools, but making sure they talk to each other. A proper integration creates a complete data pipeline, from the initial ad impression right through to a closed deal in your CRM.
This is how a customer's path gets tracked in practice: UTMs tag where they came from, attribution maps the route they took, and a model assigns the right value to each touchpoint.
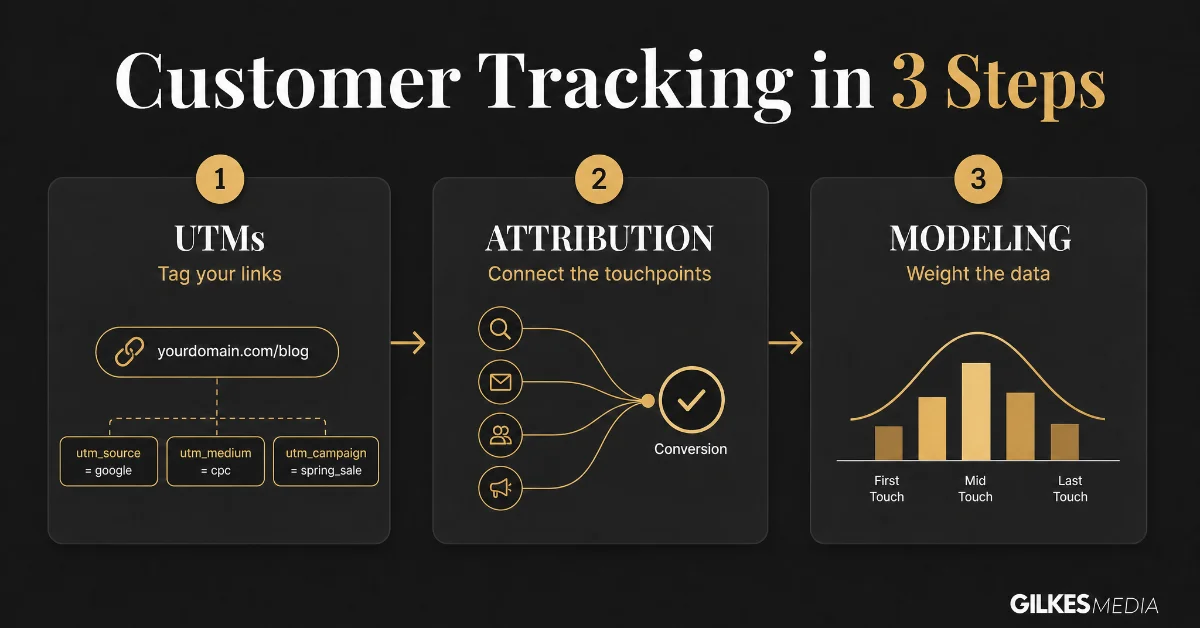
This process organises what would otherwise be disconnected data points into a meaningful story about customer behaviour and campaign performance.
With your data sources connected, the next job is to visualise it all in a way that answers your most important commercial questions. A tool like Looker Studio (which used to be Google Data Studio) is perfect for this. It is free and pulls data directly from Google Analytics and Google Ads.
Your dashboard should not be a data dump. It must tell a story.
A great dashboard surfaces insights, not just metrics. It should immediately answer three questions: What is working? What is not? And where should we allocate our next pound for the best possible return?
To get there, structure your dashboard around these key visualisations:
| Chart/Metric | What It Shows | The Commercial Question It Answers |
|---|---|---|
| ROI by Channel | A bar chart comparing the ROI of Google Ads, Meta Ads, Email, etc. | "Which of our marketing channels are the most profitable?" |
| CAC Trend Over Time | A line graph showing how your Customer Acquisition Cost has changed monthly. | "Are we becoming more or less efficient at acquiring new customers?" |
| LTV to CAC Ratio | A single scorecard metric displaying this critical ratio (e.g., 3:1). | "Is our customer acquisition model sustainable and profitable long-term?" |
| Lead to SQL Rate | A funnel visualisation showing the drop-off from initial lead to qualified lead. | "Are we attracting the right kind of leads, or just tyre-kickers?" |
Building this dashboard is what makes your ROI measurement real. It turns an abstract calculation into a working tool that guides decisions, justifies your budget and proves the commercial value of your marketing.
Measuring marketing ROI is pointless unless you act on what you find. Accurate data is the starting line; the value comes from using it to make confident, commercially sound decisions.
The goal is to build a rhythm of continuous, data-driven optimisation. It is about using your ROI dashboard not as a static report, but as a live tool to guide your strategy, shift your budget, and refine your approach month after month.
With a clear ROI dashboard, you can finally see your entire marketing portfolio for what it is. Your first job is to split your activities into two camps: the high-performing channels delivering a strong return, and the underperforming campaigns dragging your overall profitability down.
Take a look at your ROI-by-channel chart. Is there an obvious winner? It is not uncommon to discover that just one or two channels are driving 80% of your profitable growth.
Email marketing, for instance, often stands out as a top performer for UK businesses. The average ROI here is a remarkable £36 for every £1 spent. Even better, segmented campaigns can drive 57% more revenue than non-segmented ones, which just goes to show how targeted optimisation directly improves your returns. You can discover more UK digital marketing insights to see how different channels stack up.
The most common mistake is spreading your budget evenly across all channels out of habit. Data-driven decision-making means having the courage to starve your underperformers and feed your winners. It feels ruthless, but it is the fastest path to maximising your overall ROI.
Once you have pinpointed your top-performing channels, the next step is to reallocate your budget to squeeze every last drop of value from them. This is not just about spending more; it is about spending smarter.
Here are a few practical actions you can take right away:
Moving budget is easier when you agree the rules in advance. Measure each campaign against the target CPA or ROAS you set earlier and the decision mostly makes itself.
| If a Campaign Is... | Your Action | Example |
|---|---|---|
| Beating its CPA or ROAS target | Scale gradually | A LinkedIn campaign produces leads at £80 against a £120 target CPA. Raise the budget in steps and check the CPA holds. |
| Missing its target badly | Pause or rebuild | A Google Ads campaign runs at £200 CPA against a £120 target. Pause it, or rework keywords, ads and landing page before spending more. |
| Sending mixed signals | Fix the weak link | A Meta campaign has a strong click-through rate but a poor conversion rate. The ad works; the landing page does not. |
For paid search, read click-through rate (CTR), cost per click (CPC) and conversion rate together to find the weak link:
Break performance down by device, location and time of day as well. Averages hide a lot. A campaign that looks mediocre overall can be profitable on mobile at lunchtime and losing money everywhere else.
Attribution tells you which touchpoints were present. It cannot tell you whether the customer would have bought anyway. Branded search and remarketing are the usual suspects, because they often pick up people who were already on their way to you.
An incrementality test, also called a holdout test, answers that question. Split your audience into a test group that sees your ads and a control group that does not, then compare conversion rates.
If the test group converts at 5% and the control group at 2%, your ads are responsible for the extra 3 percentage points. That gap, not the platform's conversion count, is what your advertising is really adding.
Google and Meta both offer conversion lift studies for accounts with enough spend. Smaller advertisers can run a rougher version by pausing a campaign in a few regions and comparing results against similar regions where it kept running.
ROI measurement only pays off if someone looks at it regularly and acts on it. This cadence works for most businesses:
Whatever the rhythm, do not react to a single day's data. It is almost always noise. Look for trends, not blips.
Even with the best plan, you are bound to run into some tricky situations when you start measuring marketing ROI in the real world. Let's tackle some of the most common questions I hear from marketers and business owners. Think of this as your quick-reference guide for those "what do I do when..." moments.
This is a classic, and for good reason. Brand-building campaigns do not have a clean, direct path to a sale like a Google Ad, but their impact is absolutely measurable. You just have to look in the right places.
Instead of trying to tie a specific sale back to a brand campaign, track the leading indicators: the metrics that show your brand is gaining ground in your market.
Focus on these signals:
While you will not get a neat ROI percentage, you can show a powerful correlation between these metrics and a long-term rise in leads and sales.
The honest answer? It completely depends on your sales cycle.
Jumping the gun and measuring ROI too early is one of the biggest mistakes I see. A B2B software business with a six-month sales process cannot possibly know the true return on a campaign after just 30 days. All they will see is the cost.
As a rule of thumb, wait for at least one full sales cycle to pass before you calculate the final ROI. For ongoing marketing, like SEO or content, it is better to use a rolling window, like a 90-day lookback, to track performance trends over time.
If you are in e-commerce with a short buying cycle, you can measure ROI much faster, sometimes within days or weeks. The key is simple: align your measurement timeframe with how your customers actually buy.
Bringing offline channels like print ads, trade shows, or direct mail into your digital reporting takes a bit of clever setup. The goal is to create a digital bridge that connects that real-world interaction to an online action you can measure.
Here are a few tried-and-tested methods:
Using these tactics lets you attribute website visits, leads, and even sales back to their offline source, giving you a far more accurate picture of your ROI.
There is no universal "good" number. It depends on your margins. A software business with very high margins can afford a far higher cost per acquisition (CPA) than an e-commerce store selling low-margin products.
Work backwards from your own finances. Use the break-even ROAS formula above (1 divided by your gross margin) and your customer lifetime value to find the most you can afford to pay for a customer. Then set your target CPA or ROAS at a level that leaves a healthy profit, rather than copying an industry benchmark.
It almost never will, and forcing the numbers to match is a waste of time. The usual causes are:
Give each source a job instead. Use the ad platform for in-channel decisions, such as which ads, audiences and creatives work best. Use GA4 and your CRM to compare channels against each other and to calculate ROI.
At Gilkes Media, we move businesses from guesswork to clarity. As a senior marketing consultant specialising in paid advertising, my focus is on building solid ROI measurement frameworks and running campaigns that deliver accountable, performance-driven results. If you need a hands-on partner to help you achieve this, book a free consultation today.
ROI is easiest to defend when your marketing budget is actually going somewhere useful. See the full range of consultancy and campaign management support on our services page, or browse more paid advertising guides for platform-specific detail.