Measuring advertising effectiveness is about understanding how well your campaigns are performing. It connects your advertising spend to tangible business results, such as leads and sales. This process goes beyond counting clicks; it is about grasping true profitability and making informed, data-led decisions to grow your business.
Let's be direct: clicks, impressions, and follower counts do not pay the bills. For ambitious UK businesses, every pound spent on advertising must be accountable. This is not a technical chore to be ticked off a list; it is a core business discipline that separates profitable, sustainable growth from wasted cash.
Many small and medium-sized businesses become entangled in complex technology or feel pressured to continue spending without a clear method of tracking returns. The result is a wasted budget and missed opportunities. Without a solid measurement framework, you are essentially guessing where your most valuable customers come from.
I encountered this exact issue with a professional services firm. They were spending thousands each month on various digital ads but had no clear idea which campaigns were generating actual clients. Their reporting consisted of a jumble of platform data that provided information about clicks but nothing about lead quality or the revenue generated.
Once we implemented a proper measurement system, we could directly link their ad spend to qualified enquiries. Within three months, they were able to shift their entire budget to the two channels driving high-value clients. The outcome? They effectively tripled their lead quality while keeping their ad spend completely flat.
This shift in focus transformed their advertising from an unpredictable expense into a reliable growth engine. It is a perfect example of why measuring marketing campaign effectiveness is crucial for real business growth.
Getting this right has never been more important. With UK advertising spend recently surging by 9.7% to a record £10.6 billion in a single quarter, the competition is fiercer than ever. This growth was driven by digital channels where performance can be scrutinised, like search advertising (+12.6%) and online display (+15.2%).
For leadership teams, this sends a clear message: you must be able to justify your budgets with tangible returns.
Ultimately, effective measurement allows you to:
This guide moves past vanity metrics to a practical, consultant-led approach grounded in performance. We will walk through the exact steps you need to build a system that makes every pound of your ad spend work harder for you. This is a core principle of what performance marketing truly means.
Effective advertising measurement does not start with diving into complex reports. It begins with building a solid, reliable data foundation. Without it, any analysis you attempt will be based on guesswork and patchy information, making smart decisions impossible.
Think of it like building a house; you would not start putting up walls without first laying the proper foundations. This is the non-negotiable first step towards understanding what truly drives your business growth. Getting this right means you can confidently attribute results to specific campaigns, which is the entire point of measuring effectiveness.
This chart breaks down the journey from tracking basic, often misleading, metrics to achieving genuine, profitable growth.
The key takeaway is that your measurement needs to evolve. It must move beyond surface-level data to become a strategic tool that directly impacts your bottom line.
Your first task is to set up the essential tracking codes. These are often called 'pixels' or 'tags' and are small snippets of code placed on your website to monitor user actions and report on conversions.
For most businesses, a few are essential:
Alongside these platform-specific tags, Google Analytics 4 (GA4) should be the central hub for understanding all your website traffic. It provides a cross-channel view of performance, showing how users from different sources interact with your site. Setting up conversion goals in GA4 is paramount.
Once your core tracking is live, the next layer of precision comes from Urchin Tracking Module (UTM) parameters. These are simple tags you add to the end of a URL to tell your analytics platform exactly where a visitor came from. They are the single most important tool for eliminating guesswork from your reports.
For example, without UTMs, you might just see traffic from "facebook.com" in your reports. You will not know if that traffic came from a paid ad, a specific campaign, or a link in an organic post. That ambiguity makes real optimisation impossible.
A properly structured UTM tells you the source, medium, campaign, and even the specific ad creative that drove a click. This level of detail allows you to confidently double down on what works and cut what does not.
Building a solid framework for how you collect and organise this data is a discipline in itself. For a deeper dive, check out a practical guide to building your marketing data strategy for excellent insights.
A consistent UTM strategy should track several key dimensions:
| Parameter | Purpose | Example |
|---|---|---|
utm_source | Identifies the platform | facebook |
utm_medium | Identifies the channel | cpc |
utm_campaign | Name of your campaign | q4-leadgen-offer |
utm_content | Distinguishes ads | blue-graphic-ad |
By getting these foundational elements right from the start, you create a clean, reliable, and actionable source of data. This organised data is the bedrock upon which all your future measurement, analysis, and profitable decisions will be built. It moves you from ambiguity to clarity, giving you the control you need to steer your advertising investment effectively.
Before you can measure a single click, you must define what "success" actually means for your business. It is a step most companies skip, and it is why so many campaigns fail before they have even started. Vague goals like “more brand awareness” or “better leads” are impossible to measure and a surefire way to waste money.
Effective measurement does not start in Google Ads; it starts in the boardroom. It begins with crystal-clear objectives that tie directly into your wider business strategy. Every advertising goal must be a stepping stone towards a bigger commercial outcome. This is how you turn ad spend from an expense into an investment.
The real work is breaking down high-level ambitions into specific, actionable metrics that your campaigns can actually influence. An objective like "increase our market share by 10%" is great, but you cannot plug that into an ad platform. You need to deconstruct it into tangible targets.
This hierarchy is crucial. It connects the daily work of campaign management to your long-term vision, making sure every decision pushes you in the right direction.
Here is a simple, practical example of how it works:
This process turns a vague ambition into a concrete, pass/fail metric. It gives you a clear benchmark to optimise against and proves the value of your campaigns. This approach is fundamental to understanding your advertising ROI. For a deeper understanding, our guide on how to measure marketing ROI offers a complete framework.
The right Key Performance Indicators (KPIs) are never one-size-fits-all. They depend entirely on your business model. An e-commerce brand has fundamentally different success metrics from a B2B software company, and focusing on the wrong ones is a classic mistake.
For instance, a lead generation business might obsess over a low Cost Per Click (CPC). But that is a vanity metric. Clicks are irrelevant if they do not convert into paying clients. The only thing that truly matters is the cost to acquire a customer who signs a contract.
Your primary KPI should always be the metric closest to revenue. Everything else is secondary, useful for diagnosing problems but never the ultimate measure of success.
The table below breaks down the most important KPIs for different business types, helping you focus on what really drives growth.
This table offers a breakdown of primary and secondary Key Performance Indicators (KPIs) tailored to different business types. Use it to focus on the metrics that truly matter for your growth.
| Business Model | Primary KPI | Secondary KPIs |
|---|---|---|
| E-commerce | Return On Ad Spend (ROAS) | Conversion Rate, AOV, CAC |
| Lead Generation | Cost Per Acquisition (CPA) | Lead-to-Close Rate, CPL, Quality Score |
| SaaS | LTV to CPA Ratio | Trial Sign-up Rate, Churn, MRR |
Choosing the right primary KPI gives your advertising a laser-sharp purpose. For an e-commerce store, a 4:1 ROAS target is beautifully simple: for every £1 you spend on ads, you must generate £4 in revenue. That is a clear, commercially-focused goal that directly impacts your bottom line.
Once you have identified the right KPIs, the final step is to formalise them using the SMART framework. This turns abstract ideas into actionable, accountable objectives.
Your targets need to be:
By setting these commercially-grounded goals, you build the foundation for effective measurement. You stop hoping your ads will work and start building a system where performance is defined, tracked, and consistently improved. This strategic clarity is the most important first step you can take.
Once your tracking is in place and your goals are clear, it is time to tackle one of the most misunderstood but powerful concepts in advertising: attribution.
Think of it like a football team scoring a goal. The striker gets the glory for kicking the ball into the net. But what about the defender who won possession, or the midfielders who made the crucial passes? If you only credited the striker, you would have a warped view of which players are truly valuable.
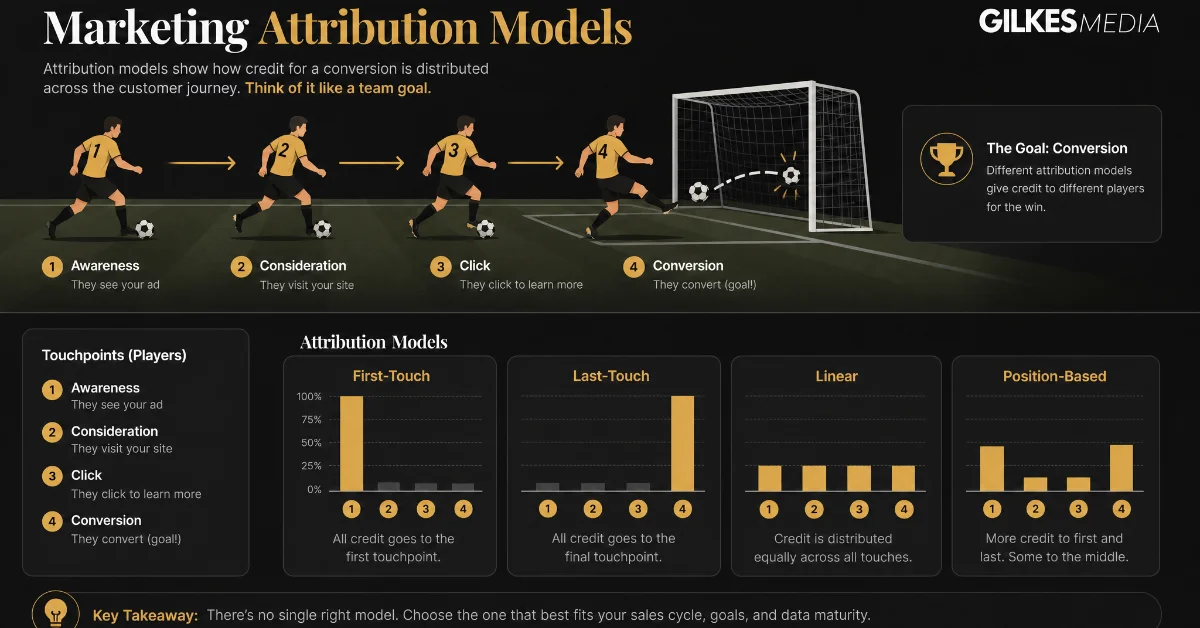
Advertising works the same way. A customer might see a LinkedIn ad, click a Google search result a week later, and finally buy after seeing a remarketing post on Facebook. Which channel gets the credit? The answer depends entirely on your attribution model.
Most ad platforms default to a Last-Click model. It is simple, but it is like only crediting the striker. It gives 100% of the credit to the very last touchpoint a customer had before converting.
The problem is that it completely ignores all the earlier interactions that introduced the customer to your brand and built trust.
Other models offer a more balanced view:
For most SMEs, moving away from the default Last-Click model is a game-changer. It provides a more honest picture of what is truly driving your business forward, allowing you to value the channels that assist sales, not just those that close them.
So, which model is right for you? It really comes down to your business realities, mainly how long your sales cycle is and how many channels you are using.
This is not a small decision. With UK internet ad revenues forecasted to hit £44 billion by 2028, and paid search taking over half of that, understanding the complete customer journey is vital. A simplistic last-click model does not capture how multiple touchpoints influence a decision, leading businesses to undervalue crucial channels. You can read more about these advertising spend forecasts to grasp the scale of the opportunity.
Here is a simple framework to guide your choice:
| Scenario | Recommended Model | Rationale |
|---|---|---|
| Short Sales Cycle | Last-Click or First-Click | The journey is short, so the first or last touchpoint is most influential. |
| Multiple Channels | Linear or Data-Driven | Multiple interactions build trust; credit should be distributed accordingly. |
| High Data Volume | Data-Driven | Let the algorithm identify the true value of each touchpoint for you. |
By picking a model that reflects how your customers behave, you can have more informed conversations about which channels are building long-term value. This is a core part of effective paid search analytics and helps you protect budgets for campaigns that might not get the final click but are essential for filling your pipeline.
It shifts your measurement from a basic report card to a strategic map of your customer's journey.
Collecting data is just the start. The real skill is turning those numbers into actions that generate profit. A spreadsheet full of metrics is useless until you interpret it and make smart decisions. That is where commercial value is created.
The goal is to move from simply looking at reports to actively questioning them. Why is Campaign A performing well while Campaign B is struggling? What does a sudden drop in conversion rate actually mean? This is where you put on your analyst hat and focus on outcomes, not just observations.
To make sense of all this data, you need one central place to see what matters. A well-designed dashboard is your command centre, pulling everything from Google Analytics and your ad platforms into a single, clear view. A tool like Google Looker Studio is perfect for this, and it is free.
A great dashboard is not cluttered with every metric. It is focused, showing only the primary KPIs you defined earlier, presented in a way that lets you see the story in seconds.
At a glance, your dashboard should answer three critical questions:
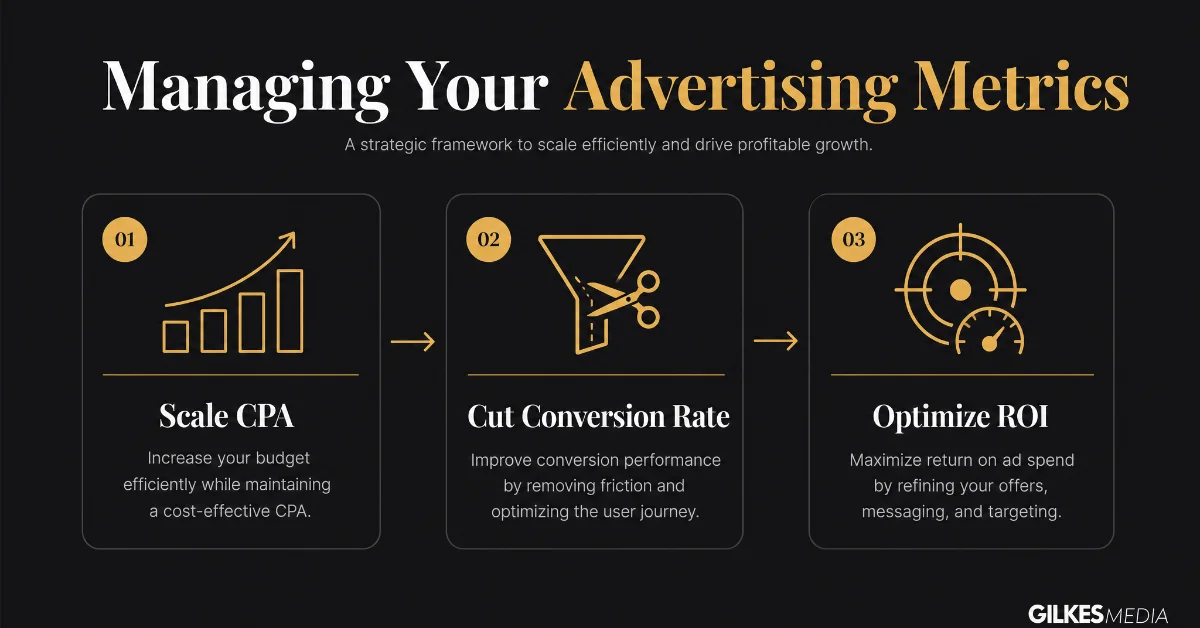
With your dashboard live, you can get to the most important part: turning insights into action. This is where you make the calls that directly impact your ROI. It is a simple but incredibly powerful framework based entirely on your KPIs.
Here is how to translate your key metrics into decisive action.
| If a Campaign Is... | Your Action Should Be... | Real-World Example |
|---|---|---|
| Meeting CPA/ROAS targets | Scale | A LinkedIn campaign generates leads at £80 CPA, below your £120 target. Cautiously increase its budget. |
| Failing CPA/ROAS targets | Cut or Optimise | A Google Ads campaign has a CPA of £200. Pause it or optimise keywords, ads, and landing pages. |
| Showing potential | Optimise | A Facebook campaign has a great click-through rate but a poor conversion rate. The ad works, but the landing page needs fixing. |
This systematic approach takes emotion out of the equation. The data tells you exactly where to put your budget for maximum impact, making sure every pound is working as hard as it possibly can.
One of the hardest questions in marketing is whether your ads are creating new customers or just taking credit for people who would have bought from you anyway.
This is where incrementality testing comes in. It is a controlled experiment designed to measure the true, causal impact of your advertising.
The simplest way to do this is a "holdout" test. You split your target audience into two groups: one sees your ads (the test group), and the other does not (the control group). By comparing the conversion rates between the two, you can measure the "lift"-the extra value your ads are genuinely creating.
If your test group converts at 5% and your control group converts at 2%, your ads are generating a 3% incremental lift. This is proof your advertising is driving new business, not just claiming credit for existing demand.
Measuring advertising effectiveness is not a one-off project. It is a continuous cycle of review, decision, and action. To turn this into a habit that fuels growth, you need a regular review cadence.
With UK advertising agency revenue projected to grow to £45.4 billion, the pressure to prove your marketing spend delivers real value has never been higher. As research on the UK advertising market shows, the consultants and agencies that thrive will be the ones who can turn complex data into clear, profitable decisions.
This structured review process ensures you are constantly learning and improving, making your advertising more efficient and profitable over time.
Even with a solid framework, a few questions always arise when measuring ad performance. As a consultant, I have seen the same uncertainties trip up founders and marketing leaders time and again.
Here are my direct answers to the most common ones.
There is no magic number. The right review cadence depends on your spending and the length of your customer decision journey. The biggest mistake is reacting to a single day's data, which is almost always just noise. You need to look for trends, not blips.
Here is a practical rhythm that works for most businesses:
This is the million-pound question, and the only right answer is: it depends entirely on your profit margins. There is no universal "good" number. A software business with 90% margins can afford a much higher Cost Per Acquisition (CPA) than an e-commerce store with tight margins.
The most critical mistake you can make is chasing a generic benchmark. A 3:1 Return On Ad Spend (ROAS)-making £3 for every £1 spent-is often cited as a baseline. But for many businesses, that would be unprofitable after factoring in the cost of goods, overheads, and tax.
To find your target, you must work backwards from your own finances. Figure out your average customer lifetime value (LTV) and your break-even point. That tells you the absolute maximum you can afford to pay for a new customer. Your real target CPA or ROAS needs to be set at a level that guarantees healthy, sustainable profit. For many of my clients, a 4:1 or 5:1 ROAS is where real growth begins.
This is a common and normal issue. The numbers will almost never match up perfectly. Trying to force them into perfect alignment is a waste of time. The key is to understand why they differ and use each platform for what it is good at.
A few things cause these discrepancies:
The best way forward is to assign each data source a specific job.
| Data Source | Its Primary Job |
|---|---|
| Ad Platform (Google Ads, Meta) | In-platform optimisation. Use it to decide which ads, audiences, and creatives are working best within that channel. |
| Google Analytics | Holistic business view. Use it to understand the full customer journey and compare how different channels perform against each other. |
When you use both platforms for their intended purpose, you get the detailed view needed for tactical tweaks and the big-picture perspective for smart, strategic planning. This dual approach is fundamental to measuring advertising properly.
Ready to stop guessing and start building a predictable growth engine for your business? At Gilkes Media, I work directly with founders and leadership teams to implement practical, profit-focused advertising strategies. If you need a senior, hands-on partner to help you measure what matters and drive real results, let’s talk.
Book your free strategy consultation with Gilkes Media today.