If you want to improve your conversion rates, you need a system. It’s about methodically analysing how users behave, making data-backed hypotheses about what is causing friction, and then testing changes to see what actually works.
This is not about guesswork. It is a commercial process for turning the website traffic you already have into more revenue.
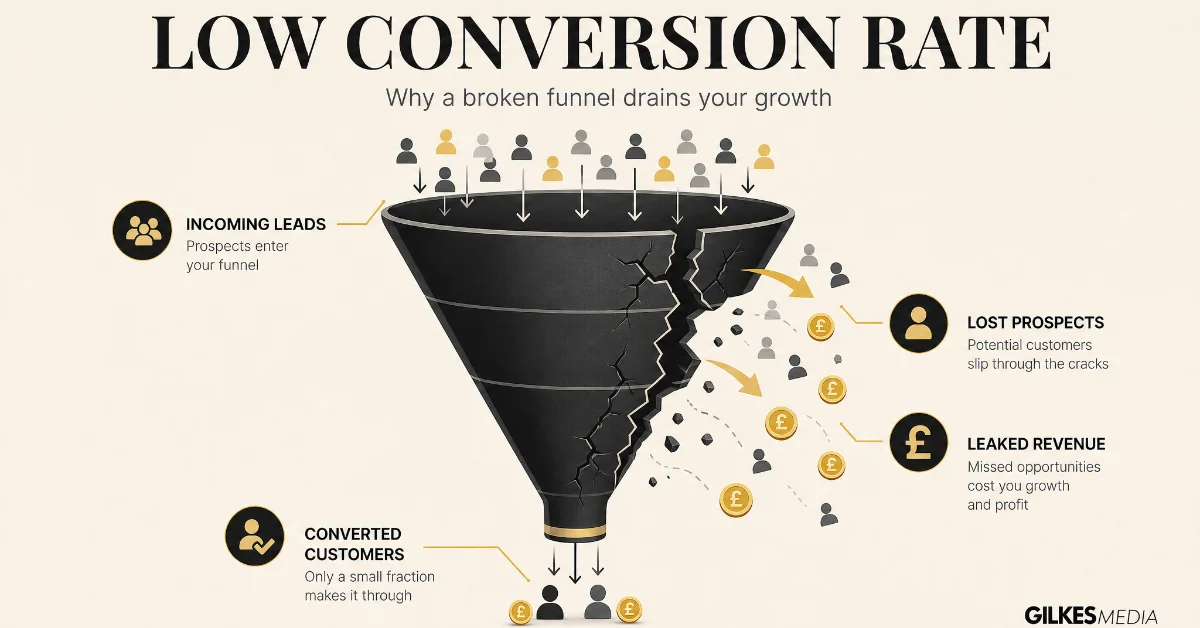
Every visitor who lands on your website and leaves without taking action, whether that is buying something, filling out a form, or calling your office, is a missed opportunity. That is leaked revenue.
You have already invested time and money to get them there, probably through paid ads or SEO. Conversion Rate Optimisation (CRO) is the discipline of plugging those leaks. It is about making more money from the traffic you already have, which is almost always cheaper and more effective than just buying more traffic.
So, what is a ‘good’ conversion rate anyway? In the UK, the ecommerce landscape shows there is plenty of room for improvement. Data from Q4 2023 puts the average UK ecommerce conversion rate at 3%. That is a bit better than the global average, but still lagging behind the EMEA region's 4.11%.
For a professional services firm with 10,000 monthly visitors, closing that 1.11% gap translates to over 100 extra qualified leads every year. That is the real-world impact of systematic CRO.
The gap between an average performer and a great one is not just a few percentage points; it is a huge amount of revenue left on the table.
Let’s say you are spending £10,000 a month on ads with a 2% conversion rate. Doubling that rate to 4% has a massive effect:
This is the core commercial argument for CRO. It multiplies the return on every single pound you spend on marketing.
Effective CRO is not a one-off project; it is a continuous cycle of improvement. It all starts with the right mindset: data over opinion.
The goal is to move from "I think we should change the button colour" to "Our heatmap data shows users are not seeing the current button, so we hypothesise that increasing its contrast will lift form submissions by 15%."
This mindset underpins every successful CRO strategy. It is all about digging into user behaviour to understand why people are not converting, forming an educated guess (a hypothesis) on how to fix it, and then testing that change to see if you were right.
This methodical approach is the foundation of a high-performance website. In fact, the principles of good CRO are deeply linked to the groundwork laid during the SEO and website development process, where a focus on user experience and clear calls to action should be baked in from the start.
To truly fix those revenue leaks, you need to understand the financial return of your efforts, which is why mastering marketing automation ROI is so critical. This guide gives you the framework to find the biggest leaks in your sales funnel and build a solid foundation for every strategic decision you make from here on out.
You cannot fix what you do not understand. Before you touch a single button or rewrite a headline, you need to become a detective. Your first job is to diagnose exactly where and why your website is leaking potential customers. This is not about guesswork; it is about gathering cold, hard evidence to move from opinions to data-backed decisions.
The foundation of any good diagnosis is knowing where you stand. It helps to see how you stack up against others, which is why we've put together a guide on what constitutes a good conversion rate for UK businesses. But honestly, the most important benchmark is your own performance, week on week. Your goal is to systematically hunt down the friction points unique to your customer journey.
Tools like Google Analytics are brilliant for telling you what is happening. For example, it might show that you have a sky-high bounce rate on a key service page. But it rarely tells you why. The "why" is where the value is.
To get that crucial insight, you have to actually watch how people behave. This is where qualitative tools become your secret weapon, letting you see your website through your customers' eyes.
Tools like Microsoft Clarity or Hotjar give you two incredibly powerful diagnostic features: heatmaps and session recordings.
Here is a heatmap from Microsoft Clarity. The bright red spots are where all the action is, the places people are clicking the most.
This kind of visual data immediately cuts through the noise. It shows you what is engaging people and what might as well be invisible.
Behavioural analytics shows you what users do. But sometimes, you just need to ask them what they think. This is where direct feedback comes in, providing the story that gives your numbers meaning.
You can get this feedback using some brilliantly simple tools:
A classic mistake is to trust just one source of data. For example, a high exit rate on your pricing page might look like a price issue in analytics. But session recordings could reveal users are actually struggling to understand the different tiers, and an exit-intent survey might confirm it with feedback like, "I couldn't find the right plan for my needs."
By combining these diagnostic methods-analytics, behavioural tools, and direct feedback-you build a complete, 360-degree view of the problem. You stop looking at abstract numbers and start seeing a prioritised list of genuine user struggles.
You might discover your main call-to-action is buried below the average scroll depth for mobile users. Or that half your visitors are repeatedly clicking on an image that is not even a link.
These are not opinions; they are data-backed observations. And each one is a clear, actionable opportunity for improvement. By the end of this diagnostic phase, you will not have a vague to-do list; you will have a dossier of evidence-based problems to solve. This is the foundation of your entire optimisation strategy, and it is how you stop guessing and start systematically improving your conversion rates.
Once you have gathered your diagnostic data, the urge to dive in and start making changes can be overwhelming. Hold off. Acting on raw data without a clear plan is a recipe for chaos, a series of untrackable tweaks that almost never move the needle.
The next, and most critical, step is to translate your findings into a structured, prioritised optimisation roadmap. This is where you bring order to the chaos, combining the hard numbers from analytics with the human behaviour insights from heatmaps, recordings, and survey feedback.
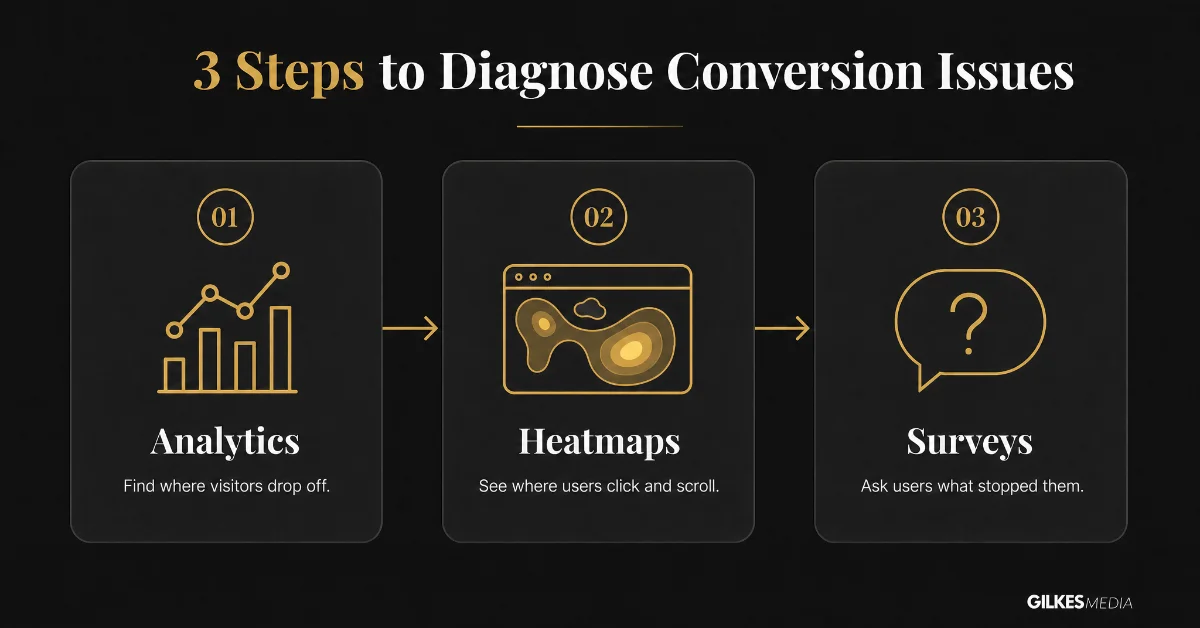
This simple workflow ensures you are not just finding problems but truly understanding the why behind them. That is the secret to creating fixes that actually work.
You will probably end up with a long list of potential improvements. The real challenge is not finding things to change; it is deciding what to change first to get the biggest return on your time and effort.
A simple but incredibly effective framework for this is the PIE model: Potential, Importance, and Ease.
You score each potential change or test against these three criteria on a scale of 1 to 10.
Once you have scored each idea, just add them up. The ideas with the highest totals go straight to the top of your roadmap. This process pulls emotion and opinion out of the equation, forcing you to focus your limited resources where they will make the most commercial impact.
To put this into practice, you can use a simple scoring table like the one below. It helps you rank your CRO ideas objectively, ensuring you tackle the highest-impact tests first.
| Hypothesis | Potential (1-10) | Importance (1-10) | Ease (1-10) |
|---|---|---|---|
| e.g., Change CTA from 'Submit' to 'Get My Free Quote' | 7 | 9 | 10 |
| e.g., Simplify checkout form from 7 fields to 4 | 8 | 9 | 7 |
| e.g., Add customer testimonials to pricing page | 6 | 8 | 8 |
By mapping out your ideas this way, you create a clear, data-informed backlog of tests that the whole team can get behind.
Every single test you run must be built on a strong, clear hypothesis. A weak hypothesis is just a guess, something like, "Changing the button colour might increase clicks." It is not actionable, and you cannot properly measure it.
A strong hypothesis, on the other hand, is a predictive statement grounded in your evidence. It follows a simple but powerful structure: "By [making this specific change], we expect to [achieve this measurable outcome] because [of this reason based on our data]."
For example: "By changing the contact form headline from 'Contact Us' to 'Get a Free Quote in 24 Hours', we expect to increase form submissions by 20% because our survey feedback showed users were unclear on the response time and value of submitting their details."
This format is brilliant because it does three things:
This structure transforms a vague idea into a scientific experiment. It forces you to justify why you are running the test and defines precisely what success looks like. Without this clarity, you cannot accurately measure the outcome or learn anything from the result, whether it wins or loses.
The final piece of your roadmap puzzle is defining the key performance indicators (KPIs) for each test. Your hypothesis will state the primary metric, ‘form submissions’, ‘add to basket’ clicks, etc. But you should always track secondary metrics to get the complete picture.
Let's say you are testing a new pricing page layout. Your primary metric might be ‘clicks on the Sign Up button’. Your secondary metrics could include:
Monitoring these secondary metrics can save you from making a bad call. A change might boost clicks on one button but also increase the page's bounce rate, suggesting it is actually creating confusion further down the line.
By creating a roadmap with prioritised, well-formed hypotheses and clear metrics, you turn a messy list of user problems into a strategic plan of action. You now have a logical sequence of tests designed to systematically improve your conversion rates, with every step tied directly to your business goals.
You have done the hard work of digging through the data and you have got a prioritised list of what to fix. Now for implementation: turning those insights into live tests and real-world improvements.
This is where we move from analysis to action. It is all about implementing changes methodically, measuring their impact with precision, and finding out what really works.
We will focus on the areas that deliver the biggest impact: your landing pages, the overall user experience (UX), and the copy you use to persuade people to act. Then, we will get into the mechanics of A/B testing, so you can be confident your results are solid.
Your landing pages are the front line, especially for your paid ad campaigns. Every single element needs to work in harmony to nudge the user towards one specific goal.
Start by obsessing over these three components:
A clunky, frustrating user experience will kill your conversions. It does not matter how persuasive your copy is if the site is a nightmare to use. Your initial research should have flagged the main friction points, but there are a few usual suspects that almost always have room for improvement.
First, navigation. Is your site structure simple and intuitive? If users have to hunt for what they need, they will just leave. Try simplifying your main menu or adding helpful internal links to guide people toward your most important pages.
Second, site speed. This has a direct, measurable impact on your revenue, especially for mobile. In the UK, a staggering 85.65% of mobile ecommerce shopping carts are abandoned. Making your site just one second faster can lift conversions by 7%. Get it down to a two-second load time and you could see a 15% uplift. For a business spending £50,000 a month on ads, that speed fix alone could generate over 2,000 extra conversions a year without touching the ad budget.
Finally, you have to be ruthless about the mobile experience. It needs to be smooth. That means big, easy-to-tap buttons, simple forms, and no pinching-to-zoom.
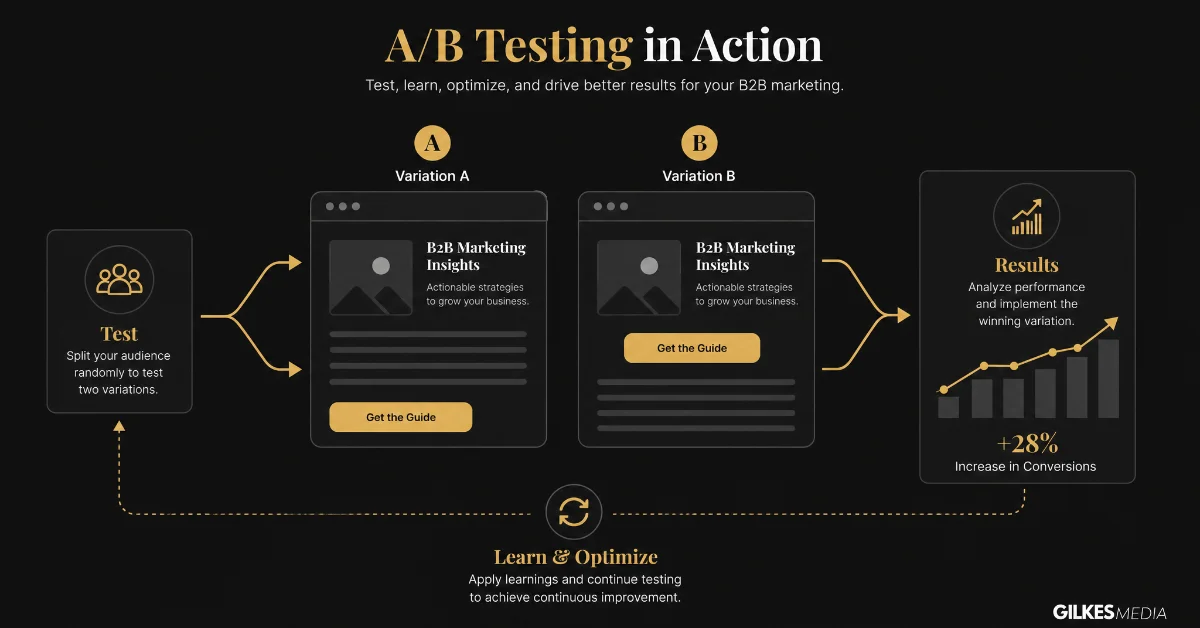
A/B testing (or split testing) is simply comparing two versions of a webpage to see which one performs better. It is the gold standard for proving your ideas actually work and are not just a lucky guess.
Getting the setup right is critical.
A test should always run for at least one full business cycle, typically one or two weeks. This accounts for different user behaviours on weekdays versus weekends. Never end a test early just because one version looks like it is winning.
By methodically implementing changes in these high-impact areas and testing them with discipline, you shift from guesswork to a systematic process of improvement. Every test, win or lose, teaches you something valuable about your customers. That insight then fuels the next round of optimisation, creating a powerful growth loop. This is how you build a website that consistently turns visitors into revenue.
Running an A/B test is only half the battle. A test is just a data point; the real value comes from what you do with that data afterwards. This is where you turn a simple experiment into a repeatable system for growth.
Once your test has run for a full business cycle, usually one or two weeks, it is time to dig into the numbers. Your testing software will show you which version drove more conversions, but the most important metric is statistical significance. This number tells you how confident you can be that the result was not just down to random chance.
You are looking for a confidence level of 95% or higher to declare a clear winner. If your new version (the "variant") beats the original with 98% confidence, you can roll out the change knowing it is almost certainly a genuine improvement.
But what about when the results are not so clear?
Every single test, win or lose, provides an insight. A winning test tells you what works. A losing or inconclusive test tells you what does not work, which helps you form a much stronger hypothesis for your next experiment.
This is how you build a flywheel of continuous improvement. Each result, positive or negative, feeds your knowledge and helps you make the next test smarter than the last.
Once you have a statistically significant winner, lock in those gains. Roll out the winning variation to 100% of your audience. The uplift you saw in the test should now become a permanent lift in your website’s performance.
Think about the real-world impact. For a business spending £20,000 a month on ads, a winning test that lifts landing page conversions from 3% to 4.5% adds hundreds of extra qualified leads every single month, for the exact same ad spend.
But the job is not finished. The best companies do not treat CRO as a one-off project; they treat it as a system. That system relies on documentation.
Create a simple spreadsheet or document to log every test you run. This becomes your company's internal 'knowledge bank', a living record of what you have learned about your specific audience. It stops you from repeating failed experiments and gets new team members up to speed instantly.
For every test, your log should capture these details:
| Hypothesis | Result (Win/Loss/Inconclusive) | Key Learning |
|---|---|---|
| e.g., "Changing CTA to be benefit-led will increase clicks." | Win (+22% uplift at 97% confidence) | Our audience responds strongly to clear outcomes in CTAs. |
| e.g., "Adding video to homepage will increase engagement." | Inconclusive (No significant change) | A homepage video does not influence lead form submissions. |
| e.g., "Removing phone number field will reduce form friction." | Loss (-15% drop at 99% confidence) | Users see the phone number as a trust signal and are less likely to convert without it. |
This simple habit is what separates the companies that dabble in CRO from those that build a genuine competitive advantage with it.
By analysing results with discipline and building a library of your learnings, you create a scalable system. You stop relying on guesswork and start making consistently better decisions, turning your website into a powerful, ever-improving engine for business growth.
When founders and marketing leaders decide to get serious about improving conversion rates, a few practical questions always come up. It is one thing to understand the theory, but another to put it into practice.
Let’s tackle some of the most common ones I hear as a consultant.
There is not a single magic number here. The real goal is to reach statistical significance in a reasonable timeframe, usually two to four weeks. If a test has to run for months on end, the results get muddy because too many other factors can change.
As a general rule, I tell clients to aim for at least 1,000 conversions per month for the specific goal you are testing. So, if you want to improve your main lead generation form, you would ideally want that form to be getting over 1,000 submissions a month.
If your traffic is lower than this, do not worry. It just means your focus should stay firmly in the diagnostic stage. Implement changes based on the powerful qualitative data you gather from heatmaps and session recordings. These are often 'just do it' fixes that do not need statistical validation and can deliver huge gains on lower-traffic sites.
I see businesses make the same handful of mistakes over and over again. Just avoiding these will put you miles ahead of most of your competitors.
For a founder or a small team, you can get a massive amount of value from just a few core tools. You do not need a complicated or expensive tech stack to get going.
My advice is always the same: start with analytics and heatmapping first. Gather your insights and build your roadmap before you invest time and money in a dedicated testing platform.
CRO and paid advertising are two sides of the same coin. Think of it as a symbiotic relationship; improving one directly boosts the other. Your ads drive the traffic, and CRO makes sure that traffic converts as efficiently as possible.
Let’s say your landing page converts at 2%. If you run a series of tests and manage to lift that to 4%, you have effectively halved your cost per lead.
That has a massive commercial impact.
It means you can either:
A strong CRO programme directly multiplies the ROI of every single pound you spend on advertising. This is precisely why at Gilkes Media we approach them as one integrated system designed for maximum commercial performance.
At Gilkes Media, we do not just talk about strategy; we execute it. As a senior marketing consultant, I provide hands-on expertise to drive measurable results. If you're ready to stop leaking revenue and start systematically improving your website's performance, let's have a conversation. Book a free, no-obligation consultation to build a clear plan for sustainable growth. Find out more at https://gilkesmedia.co.uk.