Improving your website's conversion rate needs a structured, data-led process. It is about removing friction for your users and making your value obvious. That means digging into your analytics to find the real problems, forming a testable hypothesis, and running controlled experiments like A/B tests to prove your changes work. Small improvements, made consistently, deliver the biggest commercial wins.
Your website is a sales asset, not a digital brochure. Every visitor who leaves without buying, enquiring or calling is a visitor you already paid for through ads or SEO. A low conversion rate means you are wasting that spend.
Conversion Rate Optimisation (CRO) is not a fluffy marketing task. It directly affects your revenue, profitability and cost per acquisition. It turns guesswork into a repeatable system for growth.
Consider this scenario: you spend £5,000 on a paid search campaign that drives 1,000 visitors to your website. If your site converts at 1%, you get 10 leads. That makes your cost per lead a hefty £500.
Now double your conversion rate to 2% through targeted CRO. The same £5,000 brings in 20 leads and your cost per lead halves to £250. You have doubled the efficiency of your budget without spending an extra penny on advertising.
That gives you a choice: twice the leads for the same budget, or the same leads for half the spend. By studying how users actually behave on your site, you can use the insights from your paid search analytics to find and plug costly conversion leaks.
The goal of a solid CRO programme is not just to make small tweaks. It is to build a more efficient engine for growth that turns your existing traffic into a far more profitable asset.
Small, consistent improvements compound into serious commercial gains. This guide gives you the framework to shift from buying traffic to converting it, so every pound you invest in marketing works as hard as possible.
You cannot optimise what you do not measure. Before you change anything, you need a clear picture of current performance. Guesswork is the fastest way to burn time and money.
Move beyond vanity metrics like total traffic or page views. They look nice in a report but do not tell you if the site is generating revenue. Track the user actions tied directly to your commercial goals.
The bedrock of any serious CRO programme is a properly configured analytics platform. For most businesses, that means Google Analytics 4 (GA4). Having the tracking code installed is not enough. You must define what success looks like by setting up conversions.
These are the tangible actions you want a visitor to take:
Tracking these events gives you a clear baseline. You will know exactly how many visitors become leads or customers, and later you will be able to measure the true impact of each change. Without it, you are flying blind.
GA4 tells you what is happening, but rarely why. Behaviour tools like Hotjar or the free Microsoft Clarity fill that gap.
Heatmaps show where users click, move their mouse and how far they scroll. You can instantly see which buttons and links get attention and which are ignored.
Session recordings go further, with anonymised playbacks of real visits. Watching them is like looking over a customer's shoulder as they use your site. You see their confusion, frustration and hesitation as it happens.
Behaviour tools show what users do. Sometimes you also need to ask them what they think. Three simple methods work well:
Never trust one data source on its own. A high exit rate on a pricing page looks like a price problem in analytics. Session recordings might show people struggling to understand the tiers, and an exit poll might confirm it: "I couldn't find the right plan for my needs."
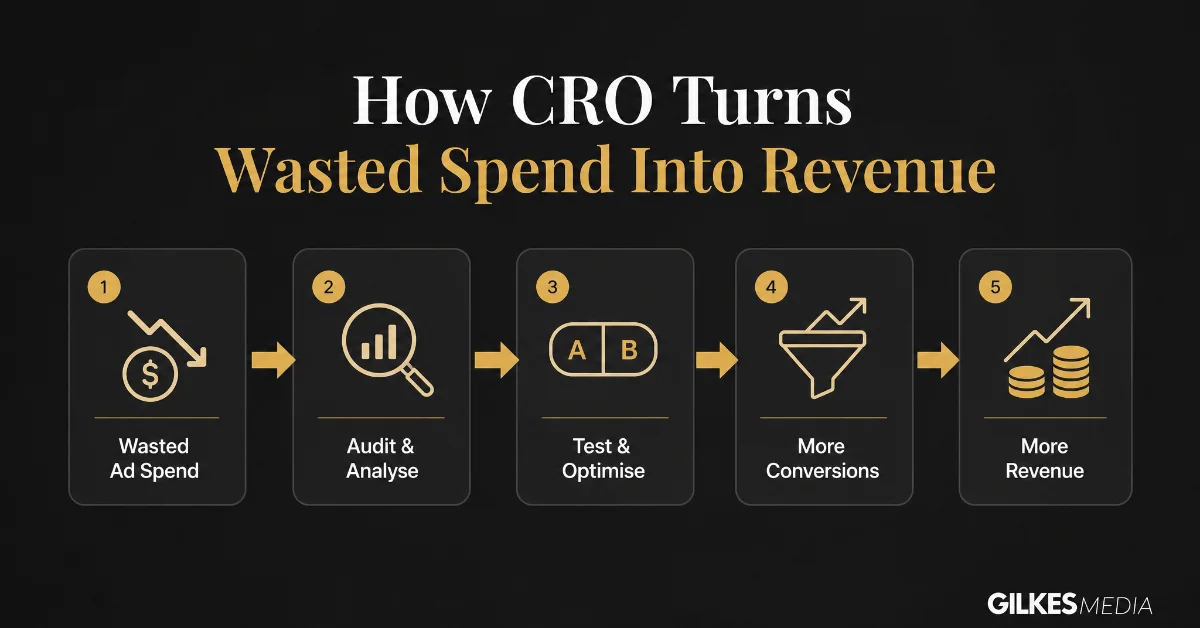
Optimisation is not about chasing new traffic. It is about getting the most value from the visitors you have already paid to acquire.
How do you know if your 2% conversion rate is good or bad? It depends on your industry. Benchmarking against your peers helps you set realistic goals and see the room for growth. Our guide on what counts as a good conversion rate goes into this in more depth.
What counts as "good" varies widely by sector, price point and traffic source. The most important benchmark, though, is your own performance week on week.
Getting analytics and behaviour tools in order is the foundation of CRO. It is also a critical part of any SEO and website development project, so a site is built to convert as well as rank.
With tracking in place, you can stop guessing and start diagnosing. The goal is a practical conversion audit that finds the 'leaks' where potential customers drop out.
This is not about nitpicking minor flaws. It is about finding the biggest, most costly blockages between a visitor arriving and you making a sale.
A conversion funnel maps the steps someone takes to become a customer. For an ecommerce store, that is usually product page, basket, checkout, thank you page. For a B2B business, it might be landing page, pricing page, contact form.
Your GA4 data shows the drop-off rate at each stage.
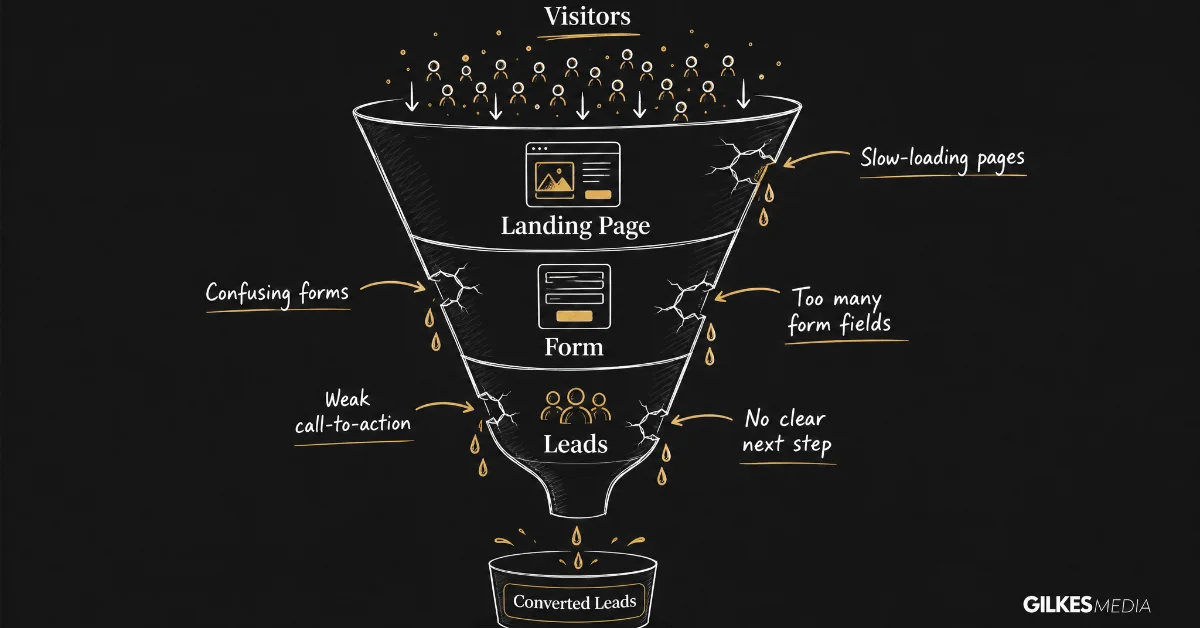
If you see a 70% drop-off between someone adding an item to their basket and starting checkout, you have found a major leak. Start there.
Once you have found a page with a big drop-off, combine the numbers from analytics with recordings from a tool like Microsoft Clarity to understand why.
Watch recordings of users who abandon at that exact stage and look for patterns:
Heatmaps complement this. If your main call-to-action (CTA) sits below the average scroll depth on mobile and gets almost no clicks, you have a straightforward problem to solve.
Your goal is to build a prioritised list of conversion barriers. You are not just looking for problems; you are looking for the problems that, if solved, will have the greatest commercial impact.
Every website is different, but some problems appear time and again. Check these first and you will often find quick wins: simple changes that deliver a fast, measurable lift.
For pages fed by paid ads, headline message match matters most. The headline has one job: to answer "Am I in the right place?" by echoing the ad the visitor just clicked. No cleverness, just clarity.
| Leak Category | Common Problems | Quick Win Opportunity |
|---|---|---|
| Value Proposition | The headline is vague. Users cannot tell what you do within five seconds. | Rewrite the main headline to be benefit-driven. Test a clearer statement of value. |
| Call-To-Action | The CTA button is hard to find or uses weak copy like "Submit". | Change button colour for contrast. Test action-oriented copy like "Get My Free Quote". |
| Trust & Credibility | The page lacks testimonials, client logos, or trust seals. | Add customer reviews or a key testimonial near the primary call-to-action. |
| Friction & Usability | The contact form is too long. The checkout requires account creation. | Remove non-essential form fields. Offer a guest checkout option. |
| Speed & Mobile | Slow load times, small tap targets, forms that need pinching and zooming. | Compress images, cut heavy scripts, enlarge buttons and simplify mobile forms. |
For inspiration, review these 11 High Converting Landing Pages.
The outcome of this audit should be an evidence-backed list of potential improvements. Each item is a candidate for testing.
Good CRO is not about making random changes based on what you think looks better. Once you have found the leaks, turn those insights into structured, testable hypotheses.
A strong hypothesis connects a specific change to a measurable outcome and the evidence behind it. The framework I use with every client is: "We believe that by [making this specific change], for [this specific audience], we will [achieve this measurable outcome], because [this is what our data showed]."
The "because" clause matters. It ties the test back to a problem you diagnosed, so whether it wins or loses, you learn something.
Here are the common leaks from earlier turned into testable hypotheses:
Your hypothesis names the primary metric, such as form submissions. Always track a few secondary metrics too, such as scroll depth, time on page and exits.
They stop you making a bad call. A change might lift clicks on one button while increasing exits further down the page, which suggests it is creating confusion elsewhere.
After a good audit, you might have a dozen solid hypotheses. You cannot test everything at once, and chasing small changes wastes traffic, time and momentum.
Simple scoring frameworks take emotion out of it. Two of the most practical are PIE and ICE.
The PIE framework scores each hypothesis from 1 to 10 on three criteria:
Add the scores together and rank your ideas.
The ICE framework stands for Impact, Confidence and Effort, again scored 1 to 10:
| Hypothesis | Impact (1-10) | Confidence (1-10) | Effort (1-10) |
|---|---|---|---|
| Change CTA copy to "Get My Free Audit" | 7 | 8 | 9 |
| Add logos & testimonial below form | 6 | 7 | 8 |
| Redesign checkout to be a single page | 10 | 6 | 2 |
Here, the button copy change is the clear winner. The checkout redesign has the highest potential impact, but the effort is massive and confidence is lower. Start with the high-impact, low-effort test.
These frameworks are thinking tools. Their job is to make sure you consistently work on the opportunities with the best chance of a real commercial return.
With a prioritised list of hypotheses, it is time to find out whether your ideas actually improve performance. The goal is rigour: decisions based on evidence, not a gut feeling that green beats blue.
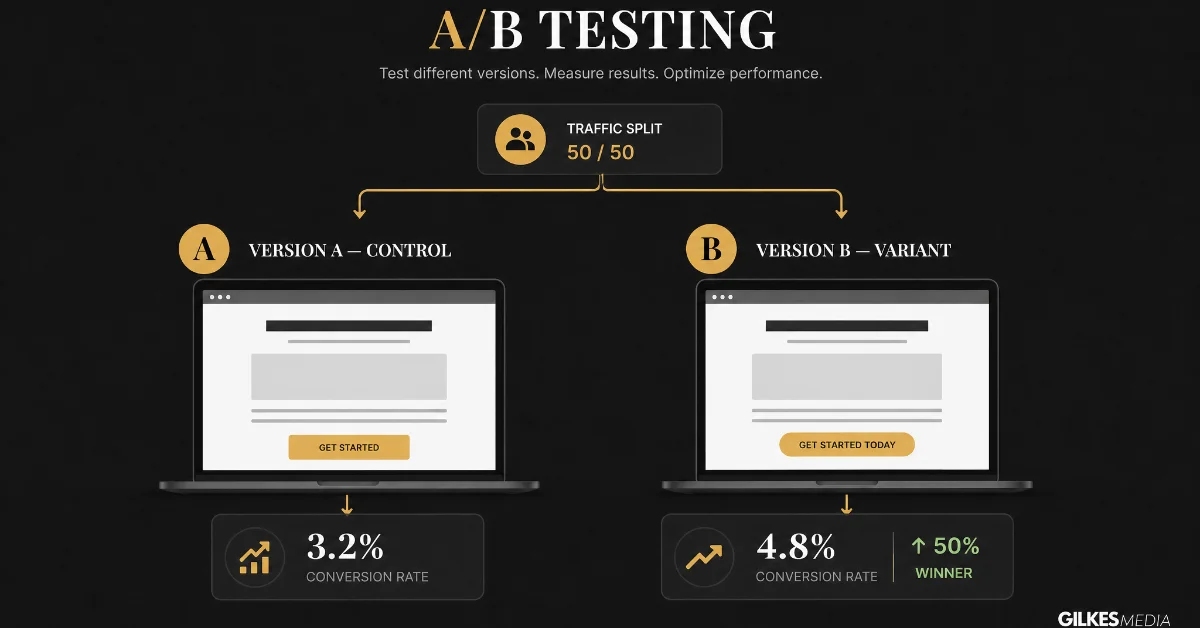
The simplest and most reliable method is an A/B test, or split test. You show 50% of your audience the current page (the 'Control') and 50% the new version (the 'Variant'), then let the data decide.
This is the only way to prove a causal link between a change and how users behave. Change one thing at a time. If you change the headline, button and image at once, you will have no idea which one made the difference.
You do not need an enterprise platform. Google Optimize was retired in 2023, so most businesses now use tools like VWO or Optimizely, or the A/B testing built into many landing page builders. Browse our list of conversion rate optimisation tools to see what fits your stack.
A poorly run test is worse than no test, because bad data leads to bad decisions. It often helps to back up A/B results with qualitative methods like conducting website user tests to boost UX conversions.
| Test Outcome | What It Means | Your Next Step |
|---|---|---|
| Clear Winner | Your variant delivered a statistically significant lift in conversions. | Roll out the winning version to 100% of your audience. |
| Clear Loser | The variant performed significantly worse than the original. | Keep the original. Now, dig into the 'why'. What did this teach you about your users? |
| Inconclusive | There was no meaningful difference in performance. | Stick with the original. Re-evaluate your hypothesis. |
A "failed" test is never a waste of time. It is an insight. If your hypothesis is proven wrong, you have learned something valuable about what does not motivate your customers.
Log every test in a simple spreadsheet. Over time it becomes your company's record of what works for your audience. It stops you repeating failed experiments and gets new team members up to speed quickly.
| Hypothesis | Result | Key Learning |
|---|---|---|
| A benefit-led CTA will increase clicks | Win | Our audience responds to clear outcomes in CTAs. |
| A homepage video will increase enquiries | Inconclusive | The video does not influence form submissions. |
| Removing the phone number field will reduce friction | Loss | Users treat the phone field as a trust signal. |
Every result feeds the next round of analysis and hypotheses. That loop is what steadily lifts your conversion rate.
These are the practical questions I hear most from founders and marketing leaders.
It depends on your traffic and the size of the changes. Small wins on high-traffic pages, like a better headline, can show a measurable lift within a couple of weeks.
Real, compounding growth comes from continuous testing over months. Each experiment must run until it reaches statistical significance (usually 95% confidence). Lower-traffic sites take longer, which is why you tackle the biggest opportunities first.
There is no magic number. The aim is to reach significance within two to four weeks. As a rough rule of thumb, I tell clients to aim for around 1,000 conversions a month on the goal being tested.
If you are well below that, stay in the diagnostic stage. Fix the obvious problems your heatmaps, recordings and surveys reveal, such as a broken mobile button or a buried CTA. These 'just do it' fixes do not need a formal test and often deliver the biggest gains on smaller sites.
It depends, and a single national average means little without context. It varies with industry, price point and business model.
A good rate for a B2B service selling £20,000 contracts might be 1-2%. A low-cost ecommerce brand might need 5% or more to stay profitable.
The only benchmark that truly matters is your own. Establish your baseline, then run a testing programme to beat it.
The cost splits into tools and expertise. You can start for free: Google Analytics and Microsoft Clarity cost nothing. Paid testing platforms range from a few hundred to several thousand pounds a month, depending on traffic and features.
| Approach | Typical Investment (Monthly) | Best For |
|---|---|---|
| DIY | £0 - £300+ (Tools only) | Founders and small teams finding quick wins. |
| Freelancer | £1,500 - £4,000+ | Businesses needing project-based expertise. |
| Consultant | £3,000 - £7,000+ | SMEs looking for strategic direction and execution. |
| Agency | £5,000 - £15,000+ | Larger companies needing a full team. |
See CRO as an investment, not a cost. A well-run programme should pay for itself many times over.
You can start yourself. Start with analytics and heatmaps, find the problems and fix the easy wins before you pay for a testing platform. It will also give you a better feel for your customers.
Scaling a programme that delivers consistently takes skill in analysis, experiment design and user psychology. Often the best approach is hybrid: build capability in-house, with an experienced consultant guiding the strategy and the more complex experiments.
For paid ads, the link is direct. Lift a landing page from 2% to 4% and you halve your cost per lead, which means twice the leads for the same budget or the same leads for half the spend.
For SEO, a page that gives visitors what they came for tends to keep them engaged, and better titles and descriptions tested through CRO can earn more clicks from search results. Make sure your testing platform is set up properly so it does not cause technical SEO problems.
At Gilkes Media, I work directly with founders and marketing leaders as a senior consultant to design and run practical, performance-driven CRO programmes. If you need a hands-on partner to turn more of your visitors into customers, let's talk.
Book a free, no-obligation strategy call with me today.
If your site design is the bigger blocker to conversions rather than just the copy or forms, our guide to choosing a web design agency covers what to look for and the red flags worth avoiding.
Browse more website development guides for further detail.